A while back, I wrote a post about the importance of trends when discussing code metrics. Metrics have an impact when teams are first exposed to them, but that tends to fade with time. Context and trend monitoring create and sustain a sense of urgency.
To understand what I mean, imagine a person aware that he has put on some weight over the years. One day, he steps on a scale and realizes that he’s much heavier than previously thought. That induces a moment of shock and, no doubt, grand plans for gyms, diets, and lifestyle adjustments. But, as time passes, his attitude may shift to one in which the new, heavier weight defines his self-conception. The weight metric loses its impact.
To avoid this, he needs to continue measuring himself. He may see himself gaining further weight, poking a hole in the illusion that he has evened out. Or, conversely, he may see that small adjustments have helped him lose weight, and be encouraged to continue with those adjustments. In either case, his ongoing conception of progress, more than the actual weight metric, drives and motivates behaviours.
The same holds true with codebases and keeping them clean. All too often, I see organizations run some sort of static analysis or linting tool on their codebase, and conclude “it’s bad.” They resolve only to do a better job in a year or two when the rewrite will start. However good or bad any given figure might be, the trend-line, and not the figure itself, holds the most significance.
Trend Metrics with NDepend
In that last post, I touched only on the topic, but not the specifics. Here, I’d like to speak to how NDepend helps you with metrics. I suspect that a lot of people know NDepend for its memorable visualization aids and its code rules and queries. I don’t see as much discussion about the valuable trend tools, perhaps because they were released comparably recently. In either case, I want to talk today about those tools.
NDepend handles trend monitoring. And, it handles it pretty easily, in terms of user experience. You simply have to define a baseline (defining a baseline is also what allows simple diff of two snapshots of the codebase). Once you do this, NDepend will track historical data corresponding to each analysis that you perform.
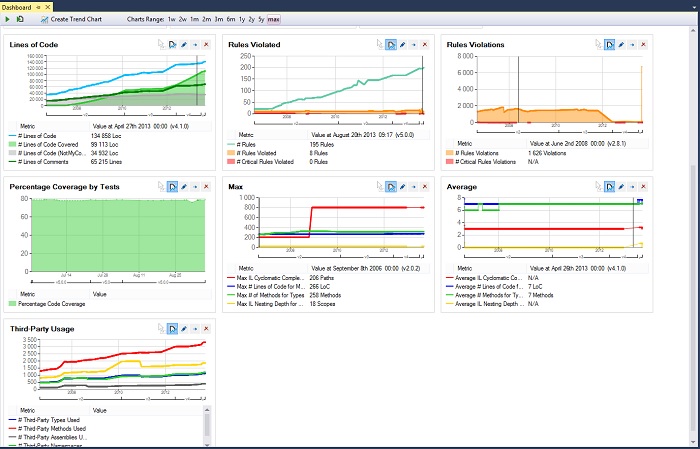
Out of the box, this shows you some interesting and colorful data right in your NDepend dashboard. In this screenshot, you see trends that typically interest the sorts of shops looking to improve: rule violations, test coverage, complexity, dependencies, etc. For the tiny effort of creating that initial baseline to start the project, this provides an awful lot of interesting information.
Mix and Match
Of course, you get more than just the defaults that appear on the dashboard. As with all NDepend features, you can customize the trending data to an impressive extent.
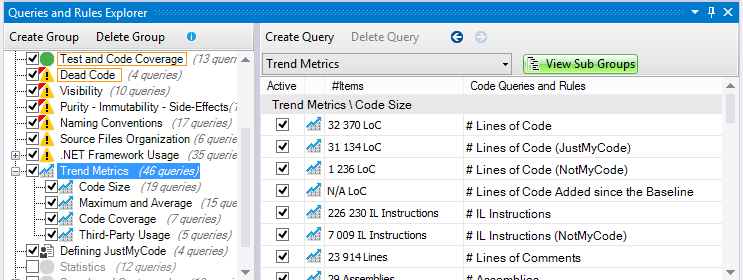
First of all, you can customize what appears on the dashboard in general. You should put whatever metrics interest you the most right there, where they catch the eye. But you can also explore metrics well beyond just the dashboard itself. The queries and rules explorer, as shown below, has an entire section devoted to trend metrics — far more than you can see in the dashboard.
With all of these trend metrics at your disposal, you can actually create your own charts as well. You can then add these charts to your dashboard, or simply access them through the NDepend user interface in Visual Studio.
Use CQLinq to Build Your Own
As powerful as it is to have 50 or so trends available to you out of the box, the actual number that you can track is unbounded. Recall that you have CQLinq at your disposal for writing your own query rules. Well, this also applies to writing your own trend rules. You can define trends on arbitrary properties that you might want to see.
In the Pluralsight course I did about NDepend, I demonstrated creating a metric, for instance, that captured the percentage of static methods in a codebase as a function of all methods. Perhaps you want to track how easily someone can add unit testing to your codebase, so things like cutting down on statics, eliminating singletons, and decreasing iceberg effect matter to you. You could use CQLinq to define all of these metrics and track them, and you can even build a composite, “testability” metric out of them (I have actually done such a thing before). You then have a visible chart, right in your dashboard, telling you whether the codebase is becoming more or less testable as time goes on.
The Value Proposition
At the beginning of this post, I talked in terms of a person at a reckoning about his weight. Capturing the metric alone doesn’t mean much, but capturing it, monitoring it, and using it to influence behavior can have a profound impact. But the most value could have been realized not through a remarkable weight loss story, but from using metrics to prevent its necessity in the first place. This doesn’t make the same kind of splashy byline as someone undergoing a massive transformation, but it is actually a vastly preferable outcome.
All too often, as a consultant, I’m called in to help when a legacy codebase is on the brink of being beyond salvage. I survey the problems and help companies figure out what to measure, how to improve, and how to sustain. But, without exception, they would all have incurred far less expense if they had done these things from day one.
The real value proposition of NDepend’s trend metrics lies not in massive turnarounds, but in keeping things healthy from day one of the project. Don’t put your codebase on the metaphorical scale, two years into a project, and pray that it’s not as bad as you fear. Put it on the scale every single day, and have some peace of mind.